Free Regional Crop Status Maps
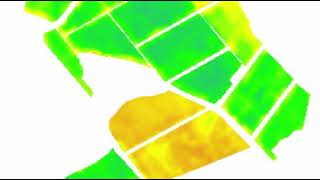
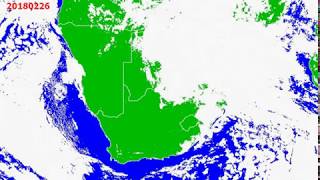
You will be happy to hear that we now offer free regional crop status maps at monthly interval. Below is an example of such a map for the Bloemhof region (South Africa) for September 2018.

Each map covers an area of approximately 30x25 km and is designed to be printed in on an A2 sheet of paper -- or you can just view it digitally of course! These maps are ideal for getting an overview of crop status in a region. They are not really meant to be used at farm level (our field-level GV maps are designed for this purpose) although the detail in these regional maps are pretty good!
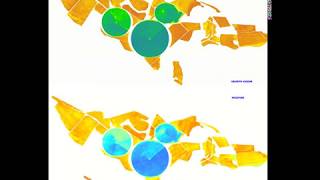
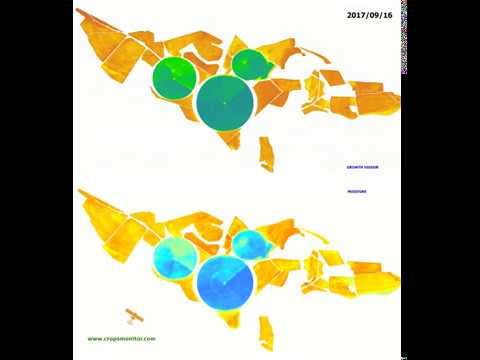
Currently, only cloud free growth vigour (GV) monthly maximum (MM) and monthly change (MC) maps are being produced, but (depending on feedback from you) we will likely extend it to moisture maps and also annual change maps (i.e. how the current situation compares to a year ago). As proof of concept, we created some GV maps for several USA, India and South Africa regions. Please let us know which other regions and countries we should add. Visit https://www.cropsmonitor.com/crop-status-maps for a full list of maps.
We would love to get your feedback on how these maps add value to our products and how we can improve them.