At last, satellite evidence that farmers are busy bodies
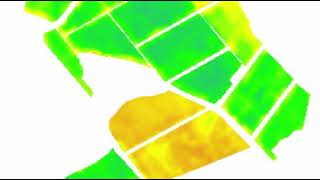
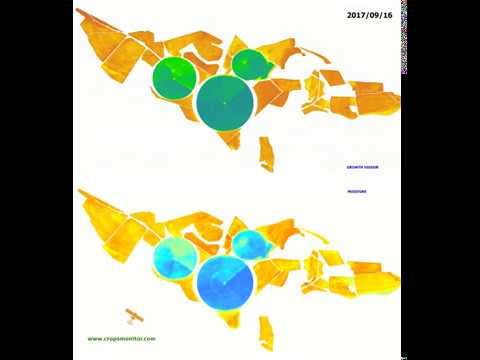
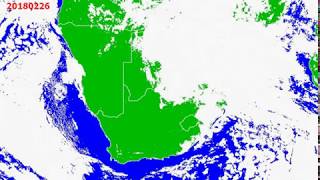
This video of satellite images shows how dynamic a typical farm is. See how the condition of a range of different crop types on this farm changed over the last few months. The upper map represents crop growth vigour, while the lower map shows moisture. One can clearly see that these two maps correspond in most fields, but in some areas there are distinct differences. One should always study the two maps together to get a true reflection of crop condition. Crops that are wet and growing vigorously are usually doing well, whereas zones with low growth and moisture should be prioritized for inspection. See more examples of crop condition maps at http://bit.ly/examplemaps. This video is definitive evidence that farmers are always busy!